


Species:
Universal
Alternative Name:
LT-C4
Assay Type:
Competitive
unit:
ng/mL
Standard:
10 ng/mL
Sensitivity:
0.057 ng/mL
Detection Range:
0.16-10 ng/mL
Assay Time:
1.5H
Sample Type:
Serum, Plasma, Tissue homogenates, Cell culture supernates and Other biological fluids
Research:
Metabolic pathway;Infection immunity;
Test Principle:
This ELISA kit uses the Competitive-ELISA principle. The micro ELISA plate provided in this kit has been pre-coated with LTC4. Standards or samples are added to the appropriate micro ELISA plate wells then with a biotin-conjugated antibody specific to LTC4. Next,Avidin conjugated to Horseradish Peroxidase (HRP) is added to each microplate well and incubated. After TMB substrate solution is added. The enzyme-substrate reaction is terminated by the addition of sulphuric acid solution and the color change is measured spectrophotometrically at a wavelength of 450nm ± 10nm. The concentration of LTC4 in the samples is then determined by comparing the OD of the samples to the standard curve.
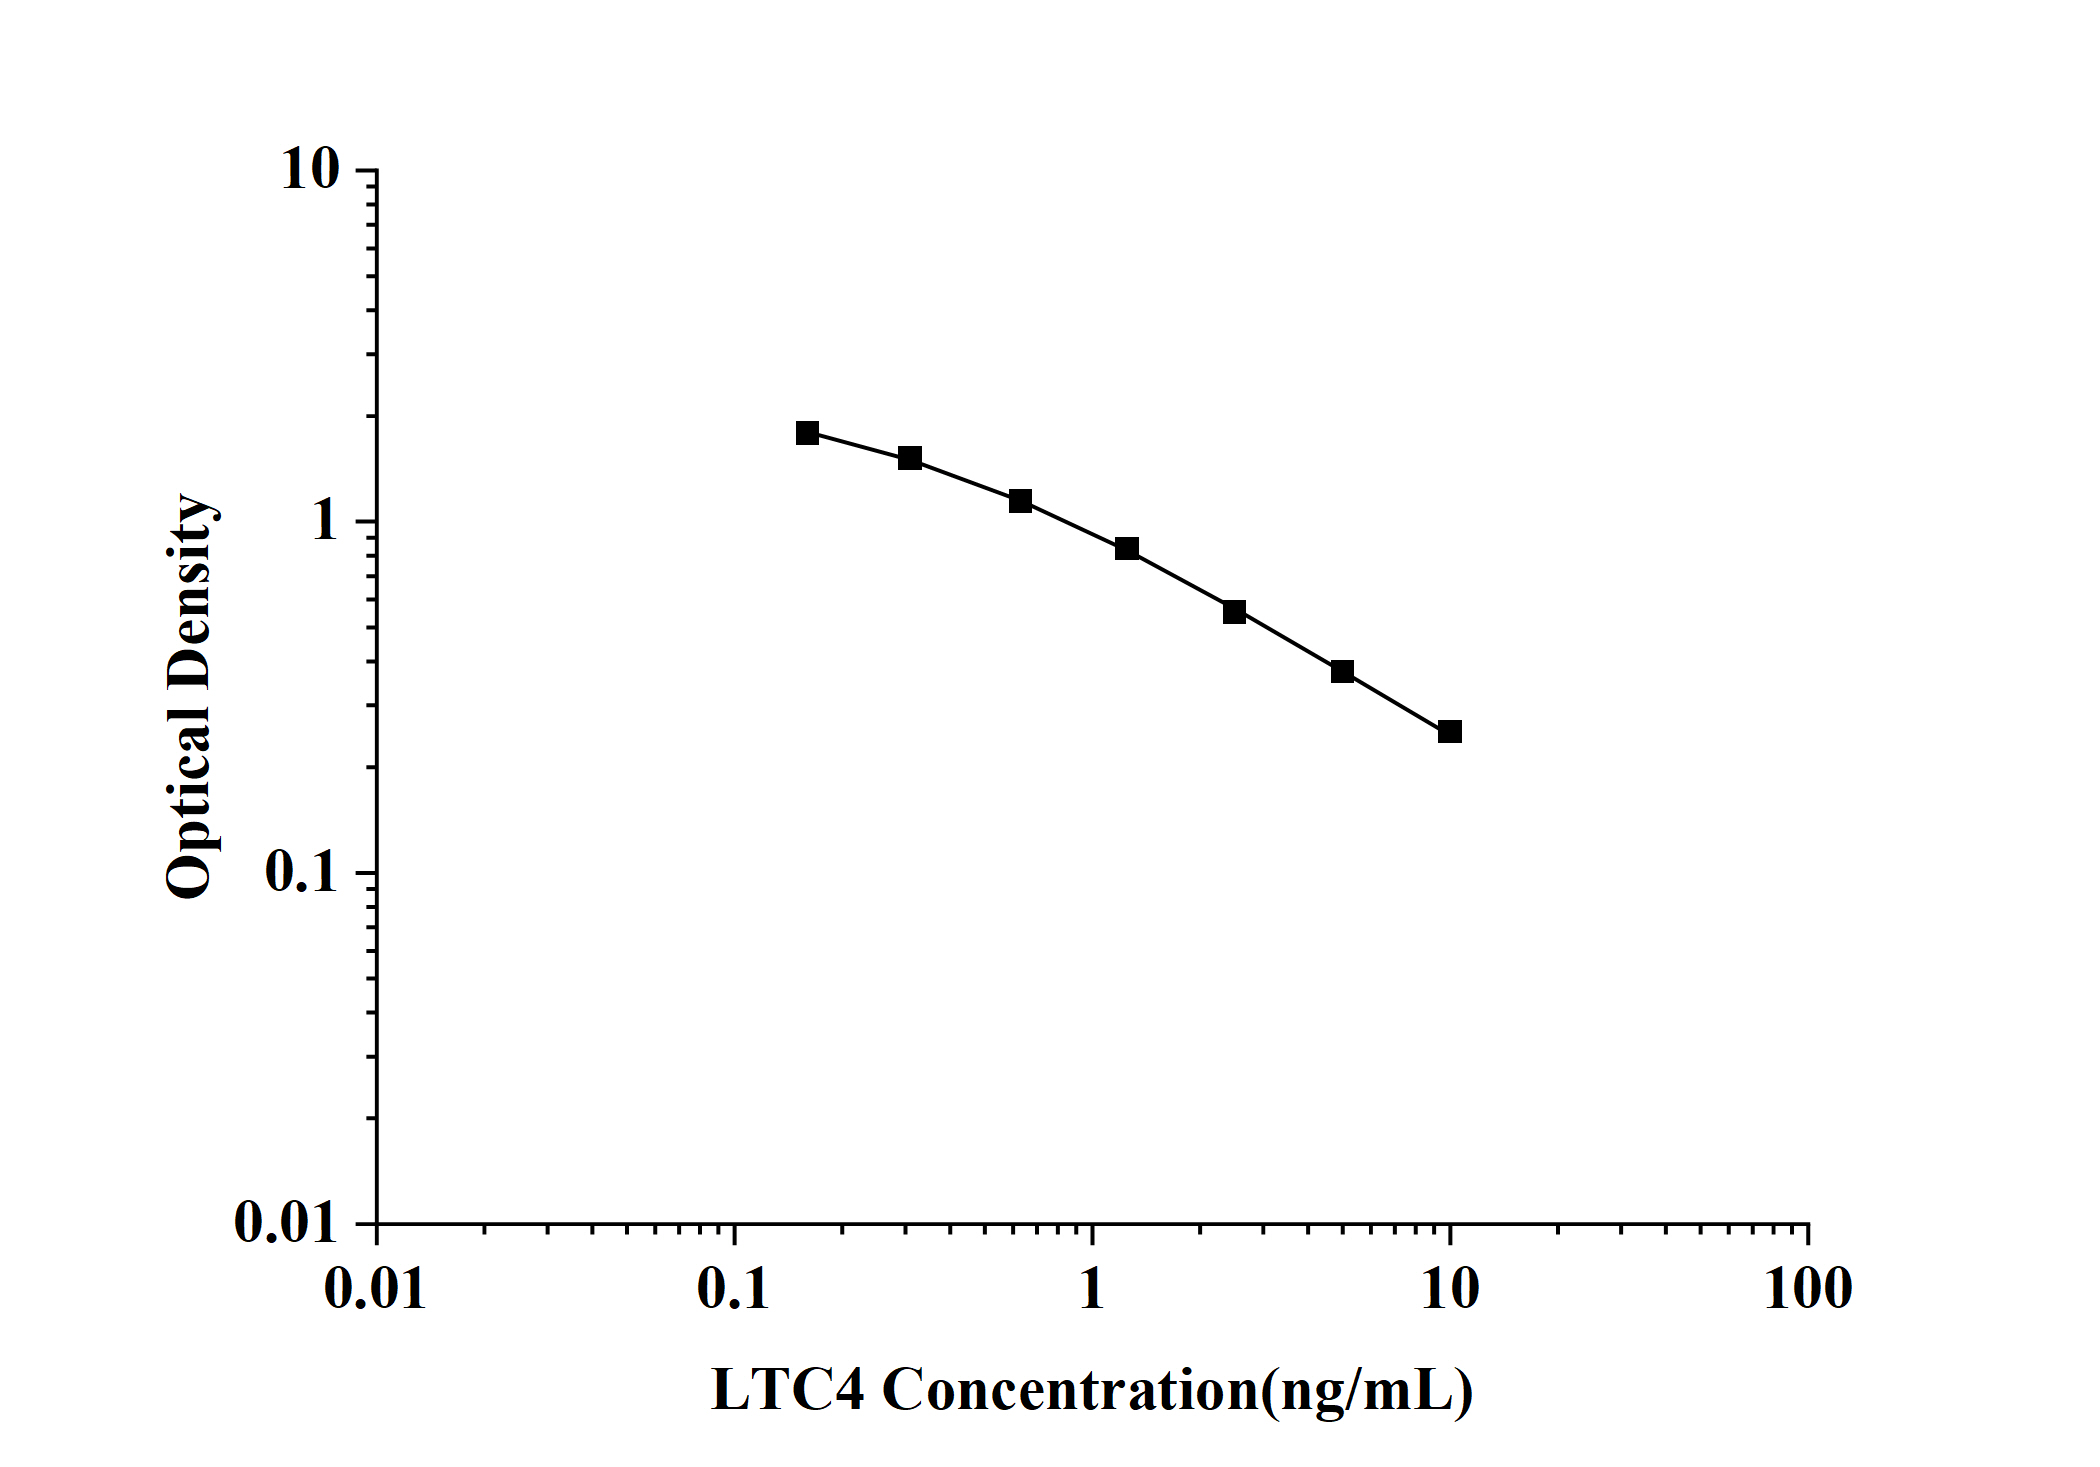
| ng/mL | OD | Corrected |
|---|---|---|
| 10 | 0.252 | |
| 5 | 0.374 | |
| 2.5 | 0.552 | |
| 1.25 | 0.836 | |
| 0.63 | 1.145 | |
| 0.31 | 1.513 | |
| 0.16 | 1.786 | |
| 0 | 2.534 |
Intra-assay Precision (Precision within an assay): 3 samples with low, mid range and high level were tested 20 times on one plate, respectively.
Inter-assay Precision (Precision between assays): 3 samples with low, mid range and high level were tested on 3 different plates, 20 replicates in each plate, respectively.
| Intra-assay Precision | Inter-assay Precision | |||||
|---|---|---|---|---|---|---|
| Sample | 1 | 2 | 3 | 1 | 2 | 3 |
| n | 20 | 20 | 20 | 20 | 20 | 20 |
| Mean(ng/mL) | 590.55 | 1260.5 | 8426.97 | 614.75 | 943.4 | 10489.51 |
| Standard deviation | 62.93 | 139.07 | 435.28 | 78.33 | 173.1 | 541.81 |
| C V (%) | 5.98 | 5.65 | 2.42 | 5.58 | 6.59 | 2.82 |
| Sample Type | Range(%) | Average Recovery(%) |
|---|---|---|
| Serum (n=8) | 90-105 | 97 |
| EDTA plasma (n=8) | 80-95 | 87 |
| Cell culture media (n=8) | 83-95 | 89 |
| Serum (n=5) | EDTA plasma (n=5) | Cell culture media (n=5) | ||
|---|---|---|---|---|
| 1:2 | Range (%) | 85-94 | 87-92 | 85-94 |
| Average (%) | 87 | 90 | 86 | |
| 1:4 | Range (%) | 87-96 | 87-92 | 82-93 |
| Average (%) | 88 | 89 | 92 | |
| 1:8 | Range (%) | 92-101 | 85-94 | 95-104 |
| Average (%) | 95 | 91 | 97 | |
| 1:16 | Range (%) | 82-98 | 89-98 | 82-96 |
| Average (%) | 96 | 90 | 88 |


